This page lists all the image charts and infographics available through Google Chart Tools.
     |
Bar
Charts (bhs, bvs, bhg, bvg, bvo)
Horizontal and vertical bar charts, with grouped or stacked series. |
 |
Box
Charts
A type of chart that shows the grouping of one or more series into quartiles, plus optional outliers. |
 |
Candlestick
Charts
A type of chart that shows a range, max, and min values for a set of data. |
  |
Compound
Charts
Combinations of two or more charts in a single image. |
Dynamic
Icons (chem)
Icons that can be embedded within another chart. |
|
 |
Google-O-Meter
Charts (gom)
A gauge with one or more arrows, indicating a value on a specified range. |
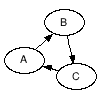 |
GraphViz
Charts (Experimental) (gv)
Charts used to visualize connectivity graphs. |
   |
Line
Charts (lc, ls, lxy)
Line charts and sparklines. |
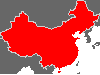 |
Map
Charts (map)
Maps highlighting specified regions, with optional marker flags. |
   |
Pie
Charts (p, p3, pc)
Two- and three-dimensional pie charts, with optional concentric rings of data. |
  |
Radar
Charts (r, rs)
A circular chart, similar to a line chart wrapped around a center point. |
 |
Scatter
Charts (s)
Chart with discrete data points, where you can specify both X and Y values. |
 |
Venn
Charts (v)
Two or three circles depicting similarity or differences between data sets. |