
This document describes how to create GraphViz charts using the Chart API.
Important: The GraphViz chart is still experimental and subject to change.
Overview
GraphViz is a package of open source tools for visualizing connectivity graphs. You can create GraphViz graphs using the DOT language and your choice of layout engines.
GraphViz charts support a different set of required parameters. Here are the supported parameters:
| Parameter | Required or Optional | Description |
|---|---|---|
cht=gv[:<opt_engine>] |
Required | Specifies a GraphViz chart. You can optionally specify a GraphViz engine. If you want to specify a layout engine, include the semicolon : mark and specify one of the following strings for <opt_engine>:
See the GraphViz website for a description of these different engines. |
chs=<width>x<height> |
Optional | If you don't specify a size, the chart will be sized automatically. |
chl=<DOT_string> |
Required | The chart to draw, in DOT language notation. You can find the DOT language reference on the GraphViz website. |
chd |
NOT USED | GraphViz codes are unusual in that the chd parameter is ignored. Don't include it in your URL. |
chof=<output_format> |
Optional | An output format for
the chart. See the parameter description to learn what output formats are
supported. If you specify chof=json, you will get
back a JSON representation of the chart as HTML image map that you can
use to add links or interactivity to the chart. See Creating
a Chart Image Map for details. |
callback=<handling_function_name> |
Optional | If you specify chof=json, you can also specify a function
to call with the returned JSON that includes the image map of the chart.
Your function must accept a single JSON parameter, which will be a JSON
representation of the chart. Your page can then specify your chart as an <img> element to render the chart, and also call the same URL with chof=json&callback=somefunc,
and include a function called somefunc() that will
parse the returned JSON and add links or interactivity. |
Examples:
| Description | Example |
|---|---|
dot engine example (default). |
|
| neato engine example of the same chart. |  cht=gv:neato |
| A dot chart, with no size specified. The chart is sized automatically. |  cht=gv |
| A more complex chart. | 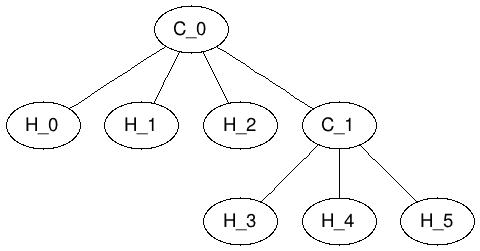 cht=gv |

Here are some tips and known limitations in the current GraphViz charts:
- The
graphattributesizeshould be not be used; use the Chart API parameterchsinstead. - The maximum number of nodes is 200, and the maximum for edges is 400.
- Anti-aliasing, transparency, and alternate fonts are not supported.
- The
nodeattributesimageandshapefileare not supported, and will result in an error if present. - The
graphattributesratio,margin, andpadare not supported, and will be ignored if present.